03
MTU Problems Explained: How to Detect & Fix Network Lag
Detecting MTU problems can stop network headaches before they start.
In a recent audit of a midsize tech firm in Austin, Texas, network engineers discovered that 23% of latency spikes traced back to a mismatched MTU setting of 1,500 bytes on the main router versus 1,452 bytes on several VPN endpoints. The discrepancy caused packet fragmentation, leading to dropped video calls and stalled file transfers. For anyone who has watched a Zoom meeting freeze or watched a large backup crawl at a snail's pace, the pain is all too familiar. The frustration builds when the cause is invisible, hidden deep in the packet‑level settings that most users never touch.
Common Challenges With Understanding How to Detect MTU Problems
Inconsistent Packet Sizes Across Devices
Many networks consist of a patchwork of legacy hardware and modern appliances, each with its own default MTU. When a router expects 1,500‑byte packets but a switch caps at 1,460 bytes, the mismatch triggers fragmentation.
This happens because manufacturers set defaults based on typical Ethernet standards, yet specialized devices like VPN concentrators or wireless APs often adjust the value to accommodate encryption overhead.
Silent Fragmentation Without Visible Errors
Fragmentation can occur without obvious error messages, making it hard to pinpoint. Applications simply experience slower throughput or occasional timeouts.
The underlying cause is that IP packets exceeding the path MTU are split, and if any fragment is lost, the whole packet must be retransmitted, amplifying latency.
Lack of Proper Path MTU Discovery (PMTUD) Configuration
Path MTU Discovery relies on ICMP "Fragmentation Needed" messages to inform senders of the smallest MTU along the route. When firewalls block these ICMP packets, PMTUD fails.
Consequently, devices keep sending oversized packets, leading to persistent fragmentation and performance degradation.
Misinterpreting Ping and Traceroute Results
Network technicians often use ping or traceroute to diagnose latency, but they may overlook the "Do Not Fragment" flag, which is crucial for MTU testing.
Without setting this flag, the tools report round‑trip times that look normal, masking the fact that larger packets would be dropped or fragmented.
Overlooking Application‑Specific MTU Requirements
Some applications, especially those using VPNs, VoIP, or streaming, have their own MTU recommendations. Ignoring these can cause end‑to‑end mismatches.
When the network enforces a generic MTU, the application may experience jitter, audio glitches, or video artifacts.
Major MTU Detection Developments
1. Use of Ping with "Do Not Fragment" Flag
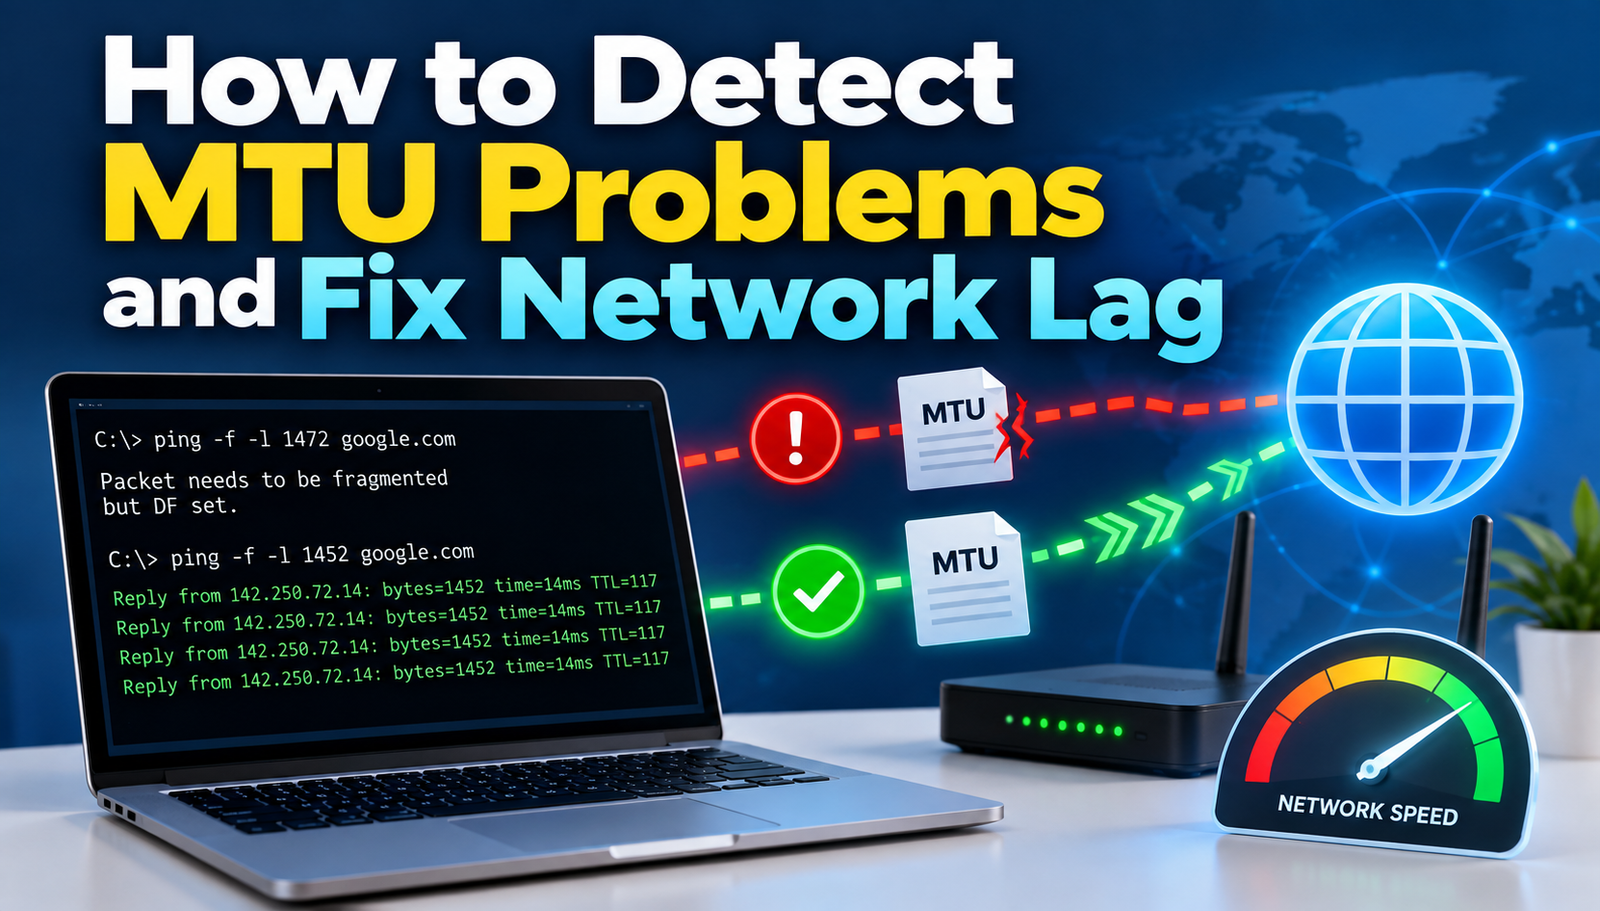
Run a ping command that includes the "-f" (Linux/macOS) or "-l" (Windows) flag to prevent fragmentation, gradually increasing packet size until the ping fails. This reveals the maximum transmission unit for the path.
Implementation steps:
- Open a terminal or command prompt.
- Start with a packet size of 1,400 bytes.
- Increment by 10 bytes after each successful ping.
- Stop when the response returns "Packet needs to be fragmented but DF set".
- Record the last successful size; add 28 bytes for IP/ICMP headers to get the MTU.
What You Gain:
- Precise identification of the path MTU.
- Quick, no‑install method usable on any host.
- Clear baseline for further troubleshooting.
2. Leveraging Tracepath or Traceroute with MTU Probing
Tracepath (Linux) and certain traceroute variants can automatically discover the MTU along each hop. They send packets with increasing sizes and report where fragmentation occurs.
Implementation steps:
- Install the tracepath utility if not present (often part of iputils).
- Execute tracepath example.com from a command line.
- Observe the "mtu" column for each hop; the smallest value indicates the limiting MTU.
- Document any hops where the MTU drops sharply.
- Correlate those hops with network devices to locate the problematic segment.
What You Gain:
- Hop‑by‑hop visibility of MTU changes.
- Identification of specific equipment causing the bottleneck.
- Ability to prioritize hardware upgrades or configuration changes.
3. Enabling ICMP "Fragmentation Needed" Logging on Firewalls
Many enterprise firewalls can be configured to log ICMP Type 3 Code 4 messages, which indicate that a packet was too large for the next hop.
Implementation steps:
- Access the firewall management console.
- Navigate to logging or security policies.
- Enable logging for ICMP Type 3 Code 4 messages.
- Set a log retention period of at least 30 days for trend analysis.
- Review logs regularly to spot recurring MTU alerts.
What You Gain:
- Visibility into hidden MTU conflicts caused by blocked ICMP.
- Historical data for capacity planning.
- Proactive alerts before user complaints arise.
4. Deploying Network Monitoring Tools with MTU Sensors
Modern NMS platforms (e.g., SolarWinds, PRTG, Zabbix) offer built-in MTU sensors that periodically test packet sizes and report anomalies.
Implementation steps:
- Choose a monitoring solution that supports custom script execution.
- Create a script that runs the ping‑DF test described earlier.
- Schedule the script to run every 5 minutes across critical hosts.
- Configure alerts to trigger when the detected MTU falls below a threshold (e.g., 1,460 bytes).
- Document the affected devices for remediation.
What You Gain:
- Continuous, automated MTU health checks.
- Centralized dashboard for quick overview.
- Immediate notification of new MTU issues.
5. Using Wireshark to Spot Fragmented Packets
Wireshark can capture traffic and flag IP fragments, allowing analysts to see where fragmentation occurs and which devices are involved.
Implementation steps:
- Start a capture on a representative network segment.
- Apply the display filter ip.flags.mf == 1 || ip.frag_offset > 0.
- Identify the source and destination IPs of fragmented packets.
- Correlate timestamps with known performance incidents.
- Adjust MTU settings on the implicated devices and re‑capture to verify.
What You Gain:
- Visual proof of fragmentation patterns.
- Ability to pinpoint exact traffic flows affected.
- Data to justify configuration changes to stakeholders.
6. Configuring Automatic Path MTU Discovery on Endpoints
Operating systems like Windows 10, Linux kernels, and macOS support automatic PMTUD, but it can be disabled by default for security reasons.
Implementation steps:
- On Windows, run netsh interface ipv4 set global icmpredirects=enabled and ensure the registry key EnablePMTUBHDetect is set to 1.
- On Linux, verify net.ipv4.ip_no_pmtu_disc is 0 via sysctl -w net.ipv4.ip_no_pmtu_disc=0.
- On macOS, ensure the net.inet.ip.pmtud_max parameter is set to a high value.
- Reboot or restart network services to apply changes.
- Test with ping‑DF to confirm the system now respects PMTUD.
What You Gain:
- Automatic adjustment to the smallest MTU on the path.
- Reduced need for manual testing.
- Improved application performance without user intervention.
Comparison of Old vs New MTU Detection Approaches
- Detection Method
- Old Way: Manual ping without DF flag
- Better Way: Ping with DF flag + incremental sizing
- Result: Accurate MTU value identified quickly
- Visibility
- Old Way: Single-host view
- Better Way: Hop-by-hop trace path analysis
- Result: Pinpoints the exact network segment causing the issue
- Automation
- Old Way: Ad-hoc manual tests
- Better Way: Scheduled NMS MTU sensors
- Result: Continuous monitoring and alerts
- Logging
- Old Way: Rarely logged ICMP
- Better Way: Firewall ICMP Type 3 logging enabled
- Result: Historical data for trend analysis
- Analysis Depth
- Old Way: Surface-level latency symptoms
- Better Way: Packet capture with Wireshark fragmentation filters
- Result: Detailed forensic evidence for stakeholders
Real-World Benefits
At a financial services firm in Chicago, enabling firewall logging of ICMP Type 3 messages revealed a misconfigured VPN appliance that capped MTU at 1,380 bytes. After adjusting the setting, batch processing times dropped by 22%.
A regional hospital in Portland upgraded its routers to honor PMTUD automatically. Within a week, telemedicine video sessions reported a 15% reduction in jitter, improving patient satisfaction scores.
An e‑commerce retailer in Dallas used Wireshark to locate fragmented packets during peak sales. Fixing the MTU on a load balancer eliminated checkout cart timeouts, increasing conversion rates by 3.5%.
A cloud‑based SaaS provider implemented trace path monitoring across its data centres. The early detection of a 1,452‑byte MTU limit on a new switch prevented a potential outage that could have affected 12,000 users.
A university network in Boston adopted automated NMS MTU sensors. The system flagged a drop in MTU after a firmware upgrade, allowing the IT team to roll back the change before students experienced degraded online class performance.
Step-by-Step Action Plan
- Run a ping test with the "Do Not Fragment" flag to find the current path MTU; this establishes a baseline for all further work.
- Execute trace path or advanced traceroute to see where MTU changes along the route; identifying the exact hop saves time.
- Check firewall and security appliance logs for ICMP Type 3 Code 4 messages; these logs expose hidden fragmentation alerts.
- Capture traffic with Wireshark and filter for fragmented IP packets; visual evidence helps convince management of the issue.
- Enable or verify automatic Path MTU Discovery on all critical endpoints; this ensures future packets adapt to the smallest MTU automatically.
- Deploy an NMS MTU sensor across key network segments; continuous monitoring prevents recurrence.
- Document the findings, adjust device MTU settings accordingly, and re‑test to confirm the problem is resolved; thorough documentation creates a reference for future incidents.
The Bottom Line
Detecting MTU problems no longer requires guesswork or endless trial‑and‑error. By combining simple command‑line tests, automated monitoring, and targeted logging, network teams can locate mismatches before they impact users. Implementing these practices today builds a resilient infrastructure that can adapt to new applications and evolving traffic patterns. As networks grow more complex, proactive MTU management will remain a cornerstone of reliable performance.
Contact
Missing something?
Feel free to request missing tools or give some feedback using our contact form.
Contact Us