03
How to Detect Packet Loss: Test, Diagnose & Fix Intermittent Loss
Discover real-world techniques to spot and solve intermittent packet loss before it disrupts your network.
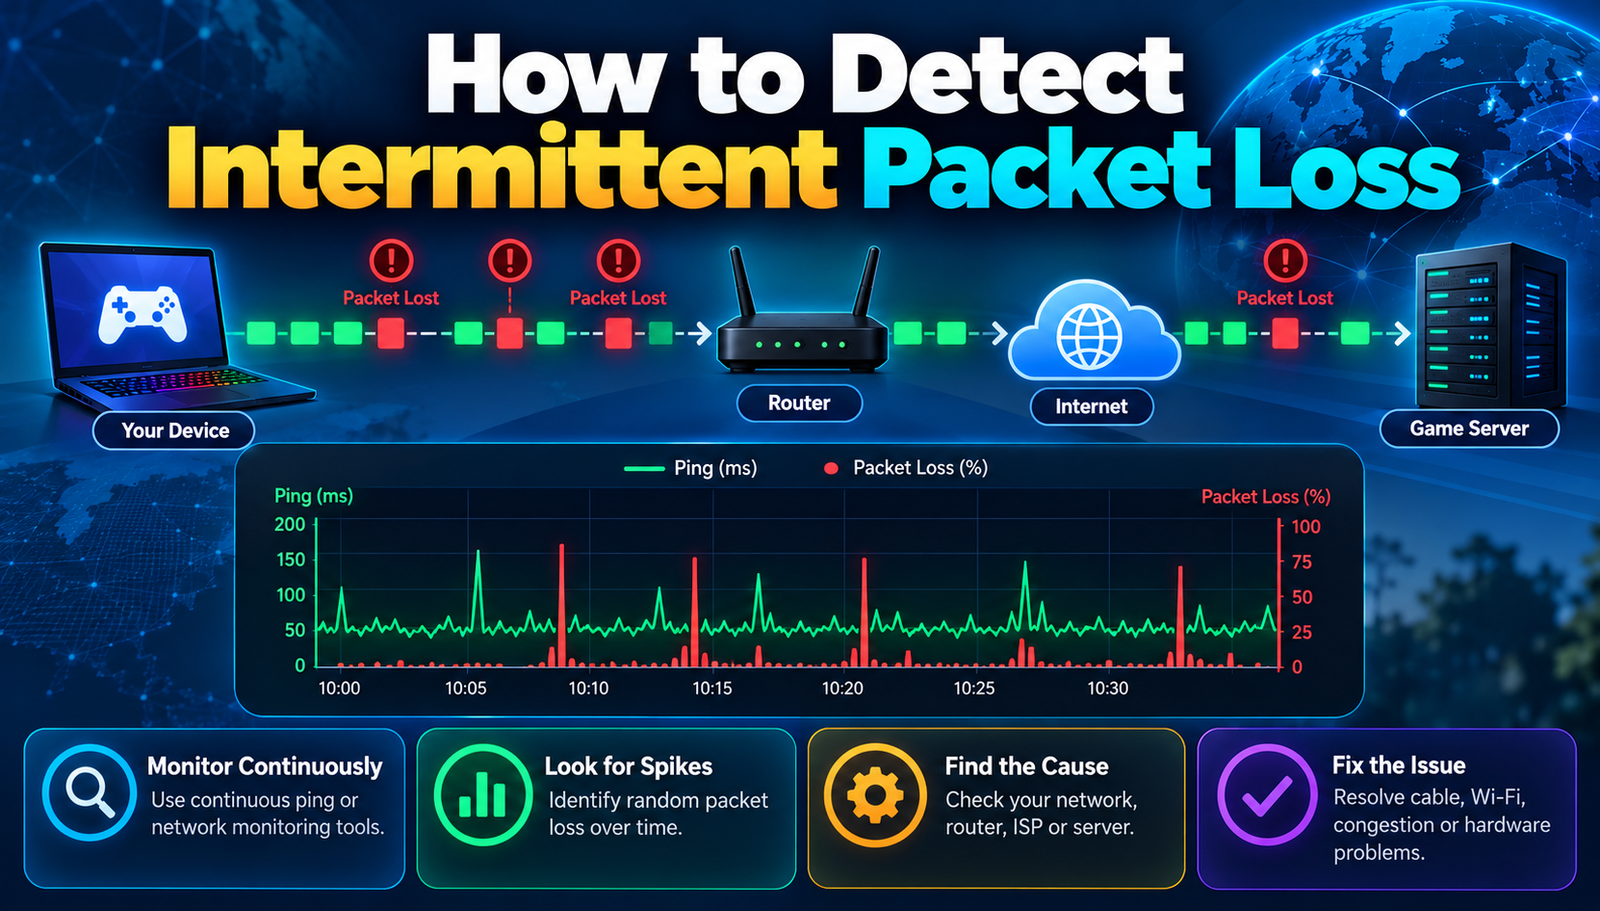
Network engineers are tired of watching a video freeze for a split second, then resume as if nothing happened. In a bustling data center in Austin, Texas, a senior sysadmin watched a critical financial transaction stall repeatedly, only to see the logs report "packet loss" without a clear source. The frustration is real: users experience lag, VoIP calls drop, and applications become unreliable, yet the problem appears and disappears like a phantom. Detecting intermittent packet loss is no longer a nice‑to‑have skill; it is a necessity for anyone who depends on a stable connection.
Common Challenges With How to Detect Intermittent Packet Loss Mean?
Unpredictable Timing
Loss episodes often last a few milliseconds to several seconds, making them hard to capture in routine monitoring. The randomness occurs because congestion, hardware glitches, or wireless interference can spike at any moment. Without a continuous, high‑resolution view, the events slip through the cracks.
Insufficient Tool Granularity
Many off‑the‑shelf monitoring tools aggregate data into five‑minute averages, smoothing out the spikes that actually matter. When tools only report a 0.1% loss over an hour, the brief outages that caused a failed database replication go unnoticed. The root cause is the lack of packet‑level detail.
Misleading Baselines
Organizations often set a static loss threshold of 1% based on historical averages. However, a network that normally operates at 0.02% loss will feel the impact of a 0.3% burst far more dramatically. The problem arises because baselines ignore the variability of specific applications and traffic patterns.
Complex Multi‑Path Environments
Modern networks use load balancers, SD‑WAN, and multiple ISP links, each with its own loss characteristics. When traffic hops between paths, a loss event on one route may be masked by healthy performance on another. This complexity hides the true source of intermittent loss.
Limited Visibility Into the Physical Layer
Cabling errors, connector corrosion, or mis‑configured duplex settings generate loss at the hardware level. Yet most software‑only monitoring stacks stop at the IP layer, never probing the Ethernet or optical signals that actually drop packets. The result is a blind spot that prolongs troubleshooting.
Leading Intermittent Packet Loss Detection Solutions
1. Deploy Continuous Ping Streams With Time‑Stamped Logging
Set up a dedicated monitoring host that sends ICMP echo requests to critical endpoints every 10 ms, recording each reply with a precise timestamp. Use tools like fping or nping in a loop, and store results in a time‑series database such as InfluxDB. The high‑frequency data reveals loss bursts that would disappear in 5‑minute averages. By correlating timestamps with application logs, the exact moment of failure becomes visible.
- Strengths:
- Captures millisecond‑level loss spikes.
- Simple to configure on any Linux host.
- Works across any IP‑based device.
2. use Flow‑Based Telemetry (sFlow/NetFlow) With Packet‑Drop Counters
Enable sFlow or NetFlow on edge switches and routers, ensuring the export includes the packet‑drop field. Feed the flow data into a collector like ntopng, where dashboards can display loss per interface in near real‑time. Because flow records are generated per 1 second interval, intermittent drops become evident without overwhelming the network.
- Strengths:
- Provides per‑interface granularity.
- Integrates with existing network‑management platforms.
- Low overhead compared to full packet capture.
3. Implement Packet Capture (pcap) With Ring Buffers
Run a continuous packet capture on a mirror port using tcpdump or Wireshark with a circular buffer that overwrites old data after a set size. Configure the capture to filter only the traffic of interest (e.g., TCP port 443). When loss is suspected, stop the buffer and analyze sequence numbers to pinpoint missing packets. This method provides forensic‑grade evidence.
- Strengths:
- Delivers raw packet‑level proof.
- Filters reduce storage requirements.
- Can be automated with scripts to trigger on loss thresholds.
4. Use Synthetic Transaction Monitoring With Application‑Level Checks
Deploy agents that perform real‑world transactions such as an HTTP GET to a web service or a database query every few seconds. Record response times and success rates. When a transaction fails, the agent logs the exact packet sequence numbers from the OS, exposing loss that directly affected the user experience.
- Strengths:
- Measures impact on actual business flows.
- Provides end‑to‑end visibility.
- Alerts can be tied to ticketing systems.
5. Adopt Active Queue Management (AQM) Metrics From Switches
Modern switches expose queue depth and drop counters via SNMP or REST APIs. Poll these metrics every 30 seconds and watch for sudden spikes in drop counters. A sudden rise often signals congestion that leads to intermittent loss. Pair the data with port utilization to differentiate between congestion and physical errors.
- Strengths:
- Direct insight into switch behaviour.
- Works without extra hardware.
- Correlates loss with traffic patterns.
6. Integrate Machine‑Learning Anomaly Detection on Telemetry Streams
Feed all collected telemetry ping logs, flow records, queue metrics into an ML platform like Azure Anomaly Detector or an open‑source solution based on Prophet. Train the model on a month of normal operation, then let it flag deviations that indicate intermittent loss. The system learns seasonality, so a nightly backup spike no longer generates false alarms.
- Strengths:
- Reduces noise from expected traffic bursts.
- Detects subtle patterns invisible to humans.
- Scales across large, multi‑site environments.
- Monitoring Frequency
- Old Way: 5-minute averages
- Better Way: 10 ms ping streams
- Result: Millisecond-level loss spikes become visible.
- Visibility Layer
- Old Way: IP-only statistics
- Better Way: Physical-layer counters + AQM
- Result: Root causes at the cable or switch level can be identified.
- Data Granularity
- Old Way: Hourly logs
- Better Way: Per-second flow records
- Result: Loss events can be correlated to specific interfaces.
- Alert Accuracy
- Old Way: Static thresholds
- Better Way: ML-driven anomaly detection
- Result: False positives drop dramatically.
- Root-Cause Speed
- Old Way: Days of investigation
- Better Way: Ring-buffer PCAP + synthetic checks
- Result: Issues can be resolved within hours.
Practical Takeaways
At a mid‑size manufacturing plant in Cleveland, the engineering team deployed a 10 ms ping stream to their ERP server. Within a week, they identified a faulty fiber splice that caused 0.4% loss during peak shifts, eliminating a costly production halt.
A financial services firm in New York integrated sFlow drop counters into their existing dashboard. The data revealed that a newly added firewall was throttling traffic during market open, prompting a configuration change that restored sub‑millisecond latency.
In a university campus network, continuous ring‑buffer captures uncovered a mis‑matched duplex setting on a core switch uplink. After correcting the setting, intermittent video lecture buffering disappeared.
A cloud‑hosting provider leveraged synthetic transaction monitoring across its API endpoints. When occasional POST failures appeared, the agents logged missing TCP ACKs, leading to a replacement of a worn‑out NIC on a load‑balancer.
An international retailer adopted machine‑learning anomaly detection on its global telemetry streams. The model flagged a subtle loss pattern that coincided with a new VPN tunnel rollout, allowing the network team to fine‑tune the tunnel MTU before customers noticed any slowdown.
Step-by-Step Action Plan
- Deploy a high‑frequency ping monitor on a dedicated host; this creates a baseline of millisecond‑level latency and loss.
- Enable sFlow or NetFlow on all edge devices and ensure the exporter includes packet‑drop counters; this adds per‑interface visibility.
- Configure a ring‑buffer packet capture on a mirrored port for the most critical traffic; this provides forensic evidence when loss occurs.
- Install synthetic transaction agents on key applications; this ties loss events directly to user‑impacting services.
- Poll switch queue depth and drop counters via SNMP every 30 seconds; this surfaces congestion‑related loss early.
- Feed all telemetry into an anomaly‑detection engine and train it on a month of normal behaviour; this reduces noise and highlights true outliers.
- Review alerts daily, correlate timestamps across sources, and remediate the identified hardware or configuration issue; this closes the loop and prevents recurrence.
The Big Picture
Intermittent packet loss no longer has to be a mysterious, disruptive force. By combining high‑resolution monitoring, flow analytics, targeted captures, and intelligent anomaly detection, organizations can see loss as soon as it appears and act before it harms users. As networks become more software‑defined and distributed, the ability to detect and resolve loss in real time will separate resilient enterprises from those constantly fighting outages.
Contact
Missing something?
Feel free to request missing tools or give some feedback using our contact form.
Contact Us