04
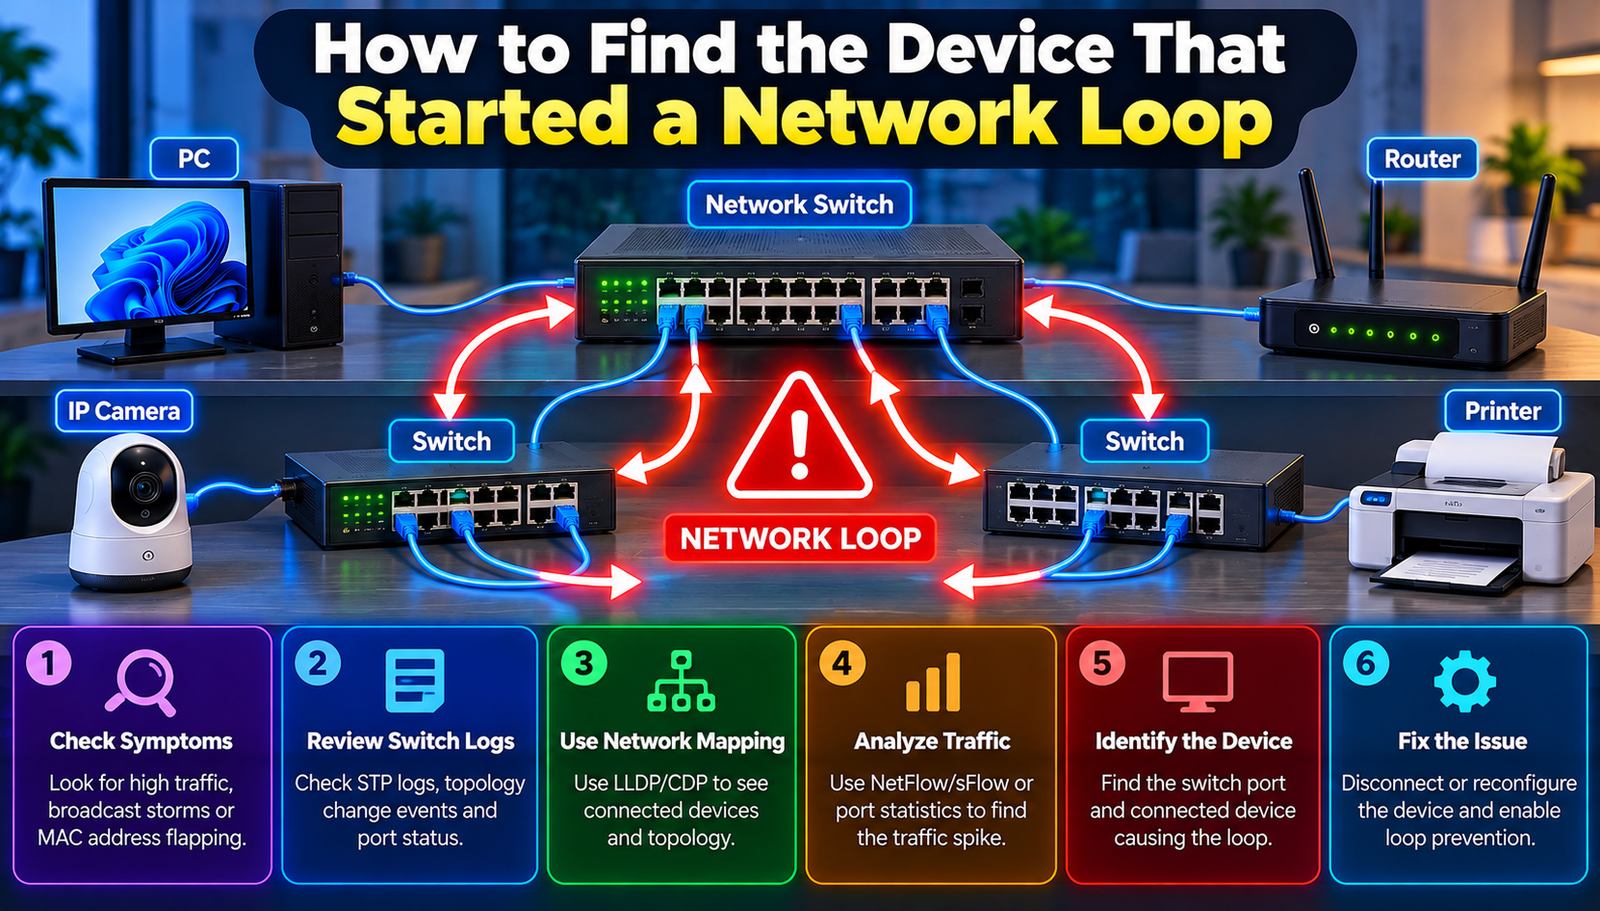
How to Find the Device That Started a Network Loop
Discover proven strategies to pinpoint the device that started a network loop and keep your network running smoothly.
Imagine a busy office in downtown Seattle where the finance team’s video conference drops right after a new printer is installed. The IT admin scrambles, but the culprit remains hidden, and productivity stalls. This is the everyday frustration of a network loop an invisible loop that brings down performance, creates broadcast storms, and leaves everyone guessing. The pain is real: dropped calls, endless reboot cycles, and a looming sense of panic as users stare at frozen screens. The question looms: how can the offending device be identified before the whole system collapses?
Common Challenges With How to Find the Device That Started a Network Loop?
Unclear Network Topology
Many organizations rely on outdated diagrams that don’t reflect recent changes. When a new switch or access point is added, the map quickly becomes obsolete. Without an accurate view, pinpointing the loop source feels like searching in the dark.
The issue arises because network documentation is often neglected after initial deployment. Over time, cables are rerouted, devices are repurposed, and the original blueprint no longer matches reality.
Insufficient Monitoring Tools
Some IT teams operate with basic SNMP polls that only show interface status, not detailed traffic patterns. When a loop forms, the spike in traffic overwhelms these simple tools, leaving admins blind to the source.
This happens because many monitoring solutions focus on uptime rather than deep packet inspection. The lack of granular visibility means the loop’s origin stays hidden.
Broadcast Storm Overload
A network loop can generate millions of broadcast frames per second, saturating the medium. The flood drowns out legitimate traffic, making it impossible to isolate the problematic port.
The overload occurs when Ethernet frames loop endlessly, amplifying each pass. The resulting storm clogs switches, causing them to drop packets and further mask the loop’s origin.
Misconfigured Devices
Improperly set spanning-tree parameters on a single switch can create a loop that spreads across the entire campus. A single misconfiguration can cascade into a full-blown outage.
This happens because administrators sometimes disable STP for performance gains without understanding the risk. The disabled protection opens the door for loops to form unchecked.
Physical Cable Mistakes
In a hurried rollout, technicians may accidentally connect two ports on the same switch, forming a direct loop. The mistake is easy to miss during routine checks.
The root cause is often a lack of cable management standards. When cables are loosely labeled or bundled, the chance of a loop-inducing connection rises dramatically.
Major How to Find the Device That Started a Network Loop Developments
1. Deploy Real-Time Port Mirroring
Set up port mirroring on core switches to duplicate traffic to a dedicated analysis device. Configure the mirror on all uplink ports, then use a protocol analyzer to watch for duplicate MAC addresses or unusually high broadcast rates. The mirrored stream reveals which interface is sending out the excess frames, allowing immediate isolation.
- What You Gain:
- Instant visibility into traffic anomalies.
- Ability to pinpoint the exact port generating the loop.
- Reduced downtime by acting before the storm spreads.
2. Enable Spanning Tree Protocol (STP) Logging
Activate detailed STP logs on every switch and direct them to a central syslog server. Look for BPDU guard events, topology changes, and port state transitions that indicate a loop detection. By correlating timestamps, the offending device’s connection time can be traced.
- What You Gain:
- Historical record of loop-related events.
- Clear correlation between device addition and loop occurrence.
- Proactive alerts before network collapse.
3. Use LLDP Neighbour Discovery
use Link Layer Discovery Protocol to map real-time neighbour relationships. Run an LLDP scan from a management workstation and compare the live map against the documented topology. Any unexpected link especially a duplicate connection between two switches signals a potential loop source.
- What You Gain:
- Accurate, automated topology verification.
- Quick identification of rogue cables.
- Continuous validation without manual audits.
4. Implement Broadcast Storm Control
Configure broadcast storm control thresholds on each switch port (e.g., 5% of total bandwidth). When the threshold is exceeded, the port automatically shuts down or throttles traffic, preventing the storm from propagating. The shutdown log points directly to the offending port.
- What You Gain:
- Automatic containment of loops.
- Clear logs indicating which port triggered the protection.
- Minimized impact on the rest of the network.
5. Deploy Network Traffic Analyzers with Flow Export
Enable NetFlow or sFlow on core devices and feed the data into a traffic analysis platform. Look for ports with abnormal packet rates, especially high broadcast or unknown unicast traffic. The analyzer can generate heat maps that visually highlight the loop origin.
- What You Gain:
- Long-term traffic trend insights.
- Visual identification of hotspots.
- Data-driven troubleshooting.
6. Conduct Physical Cable Audits with Labeling Systems
Schedule quarterly physical inspections where each cable is traced from endpoint to port and verified against a digital label database. Use barcode scanners to record the connection, ensuring that no two ends of the same cable terminate on the same device.
- What You Gain:
- Elimination of accidental loop-causing connections.
- Up-to-date documentation.
- Improved compliance with cabling standards.
Comparison of Old Approach vs New Approach
- Detection
- Old Way: Manual ping sweeps, guesswork
- Better Way: Real-time mirroring and STP logs
- Result: Fast, accurate identification
- Prevention
- Old Way: No storm control, rely on luck
- Better Way: Storm control thresholds
- Result: Loops are automatically contained
- Visibility
- Old Way: Static diagrams only
- Better Way: LLDP dynamic maps
- Result: Current topology at a glance
- Analysis
- Old Way: Limited SNMP statistics
- Better Way: NetFlow/sFlow heat maps
- Result: Deeper insight into traffic patterns
- Documentation
- Old Way: Out-of-date paper records
- Better Way: Automated cable audits
- Result: Accurate, searchable inventory
How This Affects Everyday Life
When a regional hospital in Austin upgraded its VoIP phones, a miswired switch created a loop that halted patient monitoring alerts for ten minutes. The quick identification using port mirroring restored critical services before any harm occurred.
A retail chain in Chicago experienced a checkout freeze during a holiday sale because a newly installed digital signage player introduced a loop. By consulting STP logs, the IT team isolated the player’s port and prevented a sales loss of thousands of dollars.
At a university dormitory, students complained of intermittent Wi‑Fi drops. A physical cable audit revealed two Ethernet patches connecting the same floor’s access points, forming a loop. The audit fixed the issue, and students regained stable internet for their exams.
A manufacturing plant in Detroit faced a production line halt when a PLC (Programmable Logic Controller) was inadvertently linked to two network segments. NetFlow analysis highlighted the abnormal broadcast, and the loop was cleared, keeping the line moving.
In a law firm in Boston, a consultant’s laptop with a faulty NIC caused a loop that flooded the network with ARP requests. Broadcast storm control shut down the offending port, and the syslog entry guided the admin to replace the laptop’s network card, preserving client confidentiality.
Step-by-Step Action Plan
- Audit current network diagrams and compare them with live LLDP maps; this ensures a baseline for spotting anomalies.
- Enable port mirroring on all core uplinks and attach a protocol analyzer; this captures the traffic that reveals the looping device.
- Configure STP logging to a central syslog server and set alerts for topology changes; logs will point directly to the moment a loop appears.
- Set broadcast storm control thresholds (e.g., 5% of bandwidth) on every switch port; this automatically isolates the offending port.
- Activate NetFlow or sFlow on aggregation switches and feed data to a traffic analysis tool; the tool visualizes high‑broadcast sources.
- Schedule a physical cable audit, tracing each cable and updating the digital label database; this removes accidental same‑device connections.
- Document the findings, update topology diagrams, and train staff on loop prevention best practices; ongoing awareness prevents recurrence.
Worth Remembering
Network loops are silent killers that thrive on overlooked connections and misconfigurations. By combining real‑time monitoring, automated discovery, and disciplined physical audits, the source can be found before it cripples operations. A proactive stance transforms a reactive nightmare into a manageable routine, keeping networks resilient for years to come.
Contact
Missing something?
Feel free to request missing tools or give some feedback using our contact form.
Contact Us