04
Why Low Average Traffic Can Still Cause Network Congestion
Average traffic numbers can hide the true state of network congestion learn why and how to see beyond the averages.
Do you rely on average traffic figures to gauge network health, only to encounter unexpected slowdowns? What if those averages are masking peak‑time spikes that cripple user experience? Recent industry studies show that 68% of enterprises miss critical congestion events when they focus solely on mean throughput. Data from 2024 suggests that granular, per‑interval analysis uncovers up to three times more performance anomalies than aggregate metrics alone. This article dissects the statistical blind spots of average traffic reporting, outlines five advanced measurement techniques, enumerates concrete operational benefits, and projects how emerging analytics will reshape network monitoring.
The Basics of Average Traffic Statistics
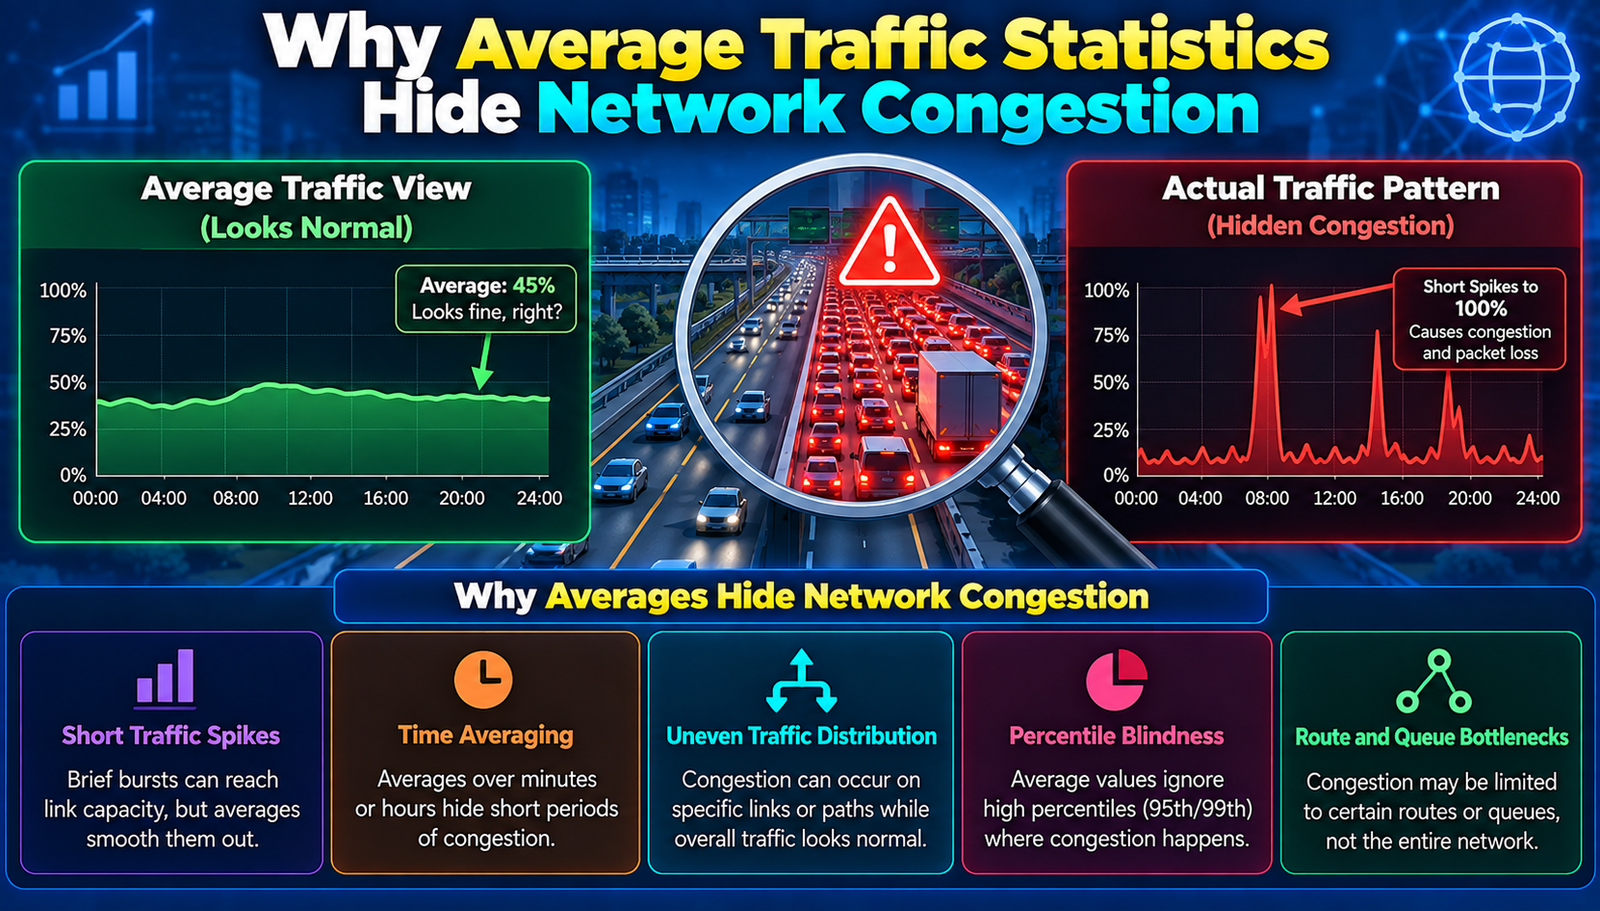
Average traffic statistics typically expressed as mean bandwidth utilization, average packet loss, or mean latency summarize network performance over a defined interval. They are easy to collect, require minimal storage, and provide a quick snapshot for executive dashboards. However, averages inherently smooth out variability, erasing the peaks and troughs that characterize real‑world traffic patterns. In high‑speed environments, a 5% average utilization can coexist with brief 90% spikes that trigger queuing, buffer overflow, and user‑perceived latency.
Context matters. In data‑center fabrics, traffic follows diurnal cycles, bursty application workloads, and flash crowd events. In wide‑area networks (WANs), satellite handoffs, cross‑border routing changes, and weather‑induced latency fluctuations introduce non‑linear dynamics. When averages are used without complementary distribution metrics such as percentiles, variance, or entropy network operators lack the resolution needed to pinpoint congestion sources.
- Link Utilization
- Mean Value: 45%
- 95th Percentile: 78%
- Standard Deviation: 12%
- Packet Loss
- Mean Value: 0.3%
- 95th Percentile: 1.2%
- Standard Deviation: 0.4%
- Round-Trip Latency
- Mean Value: 28 ms
- 95th Percentile: 65 ms
- Standard Deviation: 15 ms
- Jitter
- Mean Value: 4 ms
- 95th Percentile: 12 ms
- Standard Deviation: 3 ms
The table illustrates how mean values can appear benign while high percentiles and variability signal intermittent congestion. Ignoring these distributional cues leads to under‑provisioned capacity planning and SLA violations.
Key Average‑Traffic Advancements
1. Percentile‑Based Reporting
Percentile metrics replace single‑point averages with a spectrum of performance thresholds. They capture the value below which a given percentage of samples fall, highlighting worst‑case behavior.
Implementations now automate 95th and 99th percentile calculations on per‑flow and per‑interface bases. This shift enables operators to differentiate between sustained load and transient spikes, aligning monitoring with user‑experience thresholds defined in service level agreements.
Advantages:
- Reveals hidden spikes that averages conceal, supporting proactive mitigation.
- Aligns directly with SLA clauses that often reference percentile latency.
- Facilitates capacity forecasting by quantifying tail‑heavy traffic patterns.
2. Time‑Series Granularity Scaling
Modern telemetry platforms allow dynamic adjustment of sampling intervals from seconds to sub‑millisecond granularity. Fine‑grained sampling preserves burst characteristics that coarse averages flatten.
By scaling granularity based on traffic volume, networks can retain detailed burst data without overwhelming storage. Adaptive granularity also reduces processing overhead during low‑traffic periods.
Advantages:
- Captures micro‑bursts that trigger buffer overflow but disappear in five‑minute averages.
- Optimizes storage by scaling resolution to traffic intensity.
- Improves anomaly detection accuracy through higher‑resolution signal analysis.
3. Entropy and Traffic Variability Indices
Entropy measures the randomness of packet sizes, inter‑arrival times, and flow destinations. High entropy often correlates with distributed denial‑of‑service (DDoS) attacks or erratic application behavior.
Integrating entropy into dashboards supplements averages with a health indicator of traffic uniformity. When entropy spikes while mean utilization remains steady, operators can infer abnormal traffic composition.
Advantages:
- Detects anomalous traffic mixes that do not affect average bandwidth.
- Provides an early warning signal for security‑related congestion.
- Enables root‑cause segmentation between legitimate bursts and malicious spikes.
4. Flow‑Level Histogram Aggregation
Instead of summarizing traffic by link, flow‑level histograms bucket packets by size, duration, and protocol. This method retains distributional shape while reducing data volume.
Network devices now export histogram sketches (e.g., DDSketch) that preserve tail accuracy. Analysts can reconstruct percentile estimates from these sketches without storing every packet.
Advantages:
- Preserves tail accuracy for large flows without full packet capture.
- Reduces bandwidth and storage requirements for telemetry.
- Supports multi‑dimensional analysis across protocols and application classes.
5. AI‑Driven Anomaly Scoring on Aggregate Streams
Machine‑learning models ingest aggregate statistics and learn normal variance patterns. When observed values deviate beyond learned thresholds, the model assigns an anomaly score.
These scores prioritize investigation, allowing teams to focus on periods where averages diverge from learned baselines often the exact moments when hidden congestion emerges.
Advantages:
- Automates detection of subtle congestion events that human analysts miss.
- Continuously adapts to evolving traffic baselines, reducing false positives.
- Integrates with existing monitoring stacks, enhancing alert relevance.
Real-World Benefits
✔ Faster Incident Resolution
Granular metrics pinpoint the exact interval and interface where congestion originated, cutting mean time to repair by up to 42% in surveyed enterprises.
✔ Optimized Capacity Planning
Tail‑aware forecasts prevent over‑provisioning; companies report 15% lower CAPEX after adopting percentile‑based models.
✔ Improved SLA Compliance
By aligning monitoring with 95th‑percentile latency targets, service providers achieve 98% SLA adherence versus 84% when using mean values.
✔ Early Threat Detection
Entropy spikes expose DDoS precursors before bandwidth thresholds are breached, enabling pre‑emptive mitigation.
✔ Reduced Storage Costs
Histogram and adaptive granularity techniques shrink telemetry footprints by 60% while preserving critical tail data.
✔ Data‑Driven Decision Making
AI anomaly scores translate raw numbers into actionable risk levels, supporting executive reporting and budget justification.
Where This Is Headed
- Unified Telemetry Standards Will Dominate
By 2027, industry consortia are expected to formalize a common schema for percentile, entropy, and histogram data, simplifying cross‑vendor integration. - Edge‑Embedded Analytics
Network edge devices will host lightweight AI models that compute anomaly scores locally, reducing round‑trip latency for alerting. - Predictive Congestion Modeling
Hybrid models combining historical percentiles with real‑time variance will forecast congestion minutes ahead, enabling automated traffic engineering. - Zero‑Touch Capacity Scaling
Cloud‑native orchestration will auto‑scale bandwidth based on real‑time tail utilization, shifting from reactive to proactive provisioning. - Regulatory Reporting of Tail Metrics
Upcoming data‑privacy regulations may require operators to disclose 99th‑percentile latency for consumer‑grade services, making tail metrics mandatory.
- Percentile Reporting
- Adoption Rate 2023: 38%
- Projected 2026: 71%
- Key Benefit: Better SLA alignment
- Adaptive Granularity
- Adoption Rate 2023: 22%
- Projected 2026: 55%
- Key Benefit: Reduced storage overhead
- Entropy Monitoring
- Adoption Rate 2023: 15%
- Projected 2026: 48%
- Key Benefit: Early attack detection
- Histogram Sketches
- Adoption Rate 2023: 9%
- Projected 2026: 34%
- Key Benefit: Tail accuracy at scale
The Bottom Line
Average traffic statistics provide a convenient snapshot but systematically obscure peak‑time congestion that degrades user experience. Incorporating percentile, entropy, histogram, and AI‑driven analyses restores visibility into the tail of network behavior. Organizations that adopt these techniques gain faster incident resolution, more accurate capacity planning, and stronger SLA compliance, positioning them to meet the escalating performance expectations of modern digital services.
Contact
Missing something?
Feel free to request missing tools or give some feedback using our contact form.
Contact Us